NTP is a protocol that I find fascinating. Wireless GPS signal to a receiver, and something you can participate online, count me in!
This post is simply focused on the monitoring aspect. For the initial server setup on my Raspberry Pis, I followed a guide from this repo.
I have two pi’s running in my network. I use them as a local time source, but they also participate in the ntppool.org public NTP project. While running them is one thing, monitoring them for jitter/offset and the stratum is important to me that they are working as expected.
To take this further, I decided it was a good time to build a custom Prometheus exporter and start visualizing my own data. You can find the code for this exporter and Grafana dashboard on my own repo.
The python code has several tasks:
- Start a http server on port 9123 for Prometheus to be able to scrape for metrics
- Scrape stats from chrony’s primary selected time source
- Report the stratum level
- Normalize all output of values into microseconds
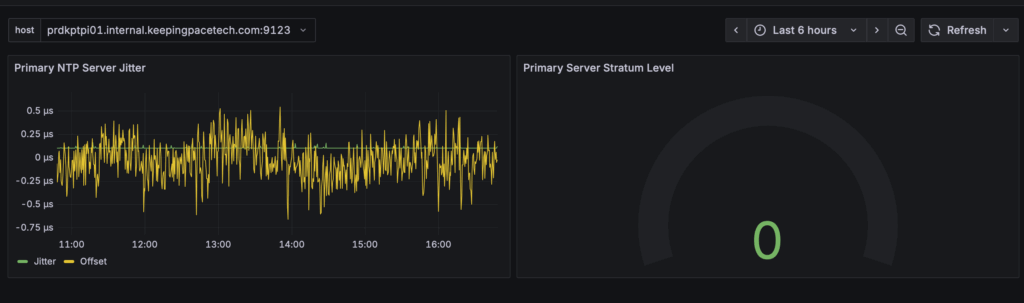
If everything goes well, you will have something like this!
In a future post, I will cover alarming to alert when the stratum level increases above 0 which means the server is not using its own GPS signal for some reason and using another internet time source.